In science we are often burrowing down rabbit holes focussed on our own endeavours with little time to determine the why of what we are doing. The NZIAHS forum gives us an opportunity to examine this broader picture which, in my case, has underpinned the direction of our Dryland Pastures Research at Lincoln University (www.lincoln.ac.nz/dryland).
Our aim has been to create farm systems that are resilient to the impacts of climate change but also have a low intensity of greenhouse gas emissions. In particular, for the past 25 years we have assumed climate change was, and is, happening and nothing that is being done globally or locally will change the inexorable warming of the planet. We base this view on the evidence presented by others.
When I first worked on climate change projects, in England in 1995, the ambient CO2 level was 350 ppm, and the annual fluctuations from ocean and deciduous tree uptake were already apparent (Figure 1). The sobering reality is that in the past 30 years none of the political or global responses scientists advocated then, have been translated into political action. Indeed fossil fuel-derived energy is unquestionably the most important source of global greenhouse gases and has shown large increases since the 1960s (Figure 2).
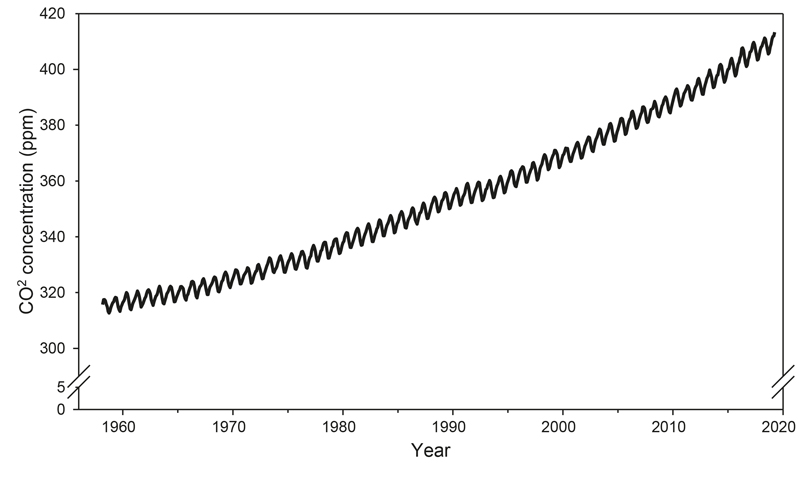 |
| Figure 1 Change in carbon dioxide (CO2; ppm) levels over time recorded at Mauna Loa, Hawaii. Data source: Dr. Pieter Tans, NOAA/ESRL (www.esrl.noaa.gov/gmd/ccgg/trends/) and Dr. Ralph Keeling, Scripps Institution of Oceanography. Online: https://scrippsco2.ucsd.edu/. |
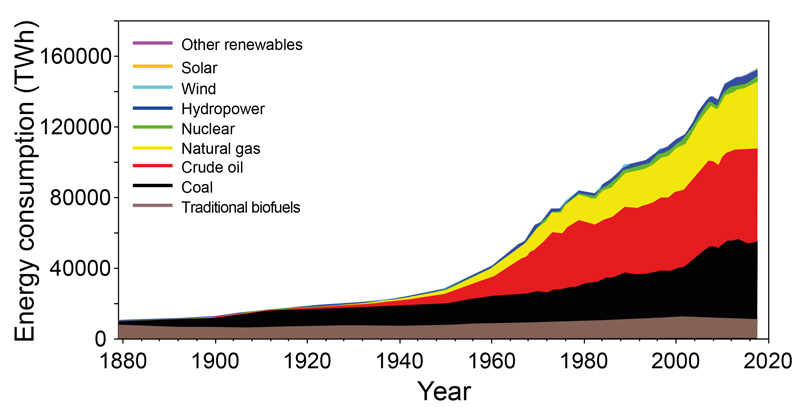 |
| Figure 2 Global energy production (TWh0 from different sources over time. Graph recreated from https://ourworldindata.org/energy-production-and-changing-energy-sources based on data from Smil 2017. |
Despite popular rhetoric there are no indications that renewable energy has the capacity to replace the current or future global fossil fuel consumption. Technically only nuclear energy could meet both the energy demand and reduced greenhouse gas emissions required by 2050.
The consequences of global warming continue to be reported, such as the loss of ice sheet mass (Figure 3) that encouraged President Trump to try and buy Greenland for oil exploration. But the cause of global warming is proving difficult to change.
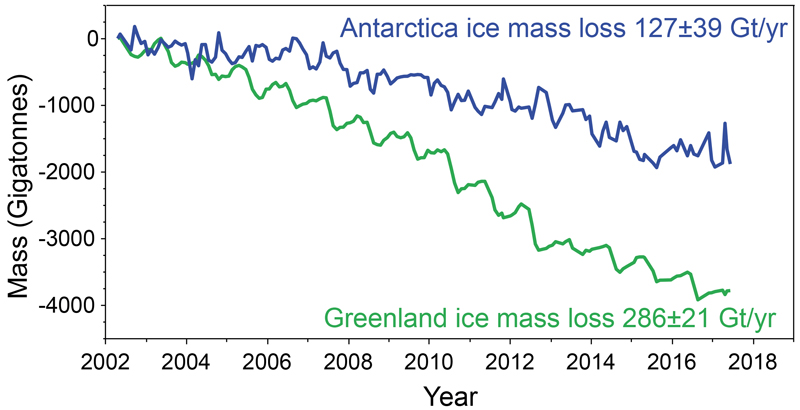 |
| Figure 3 Ice sheet losses (Gt) for Antarctica and Greenland relative to April 2002 (NASA 2019; Wise et al. 2016). |
The increased use of fossil fuel for energy consumption is directly related (R2 = 0.98) to the growing population (Figure4). To feed that population agricultural has taken two roads, deforestation and intensification. To feed 3 billion people by 1960 land clearing was necessary and the treaty of Rome advocated for intensification of agricultural production in Europe and North America to feed a continent still struggling after World War II. This was the genesis of the Common Agricultural Policy that still subsidises their agricultural production.
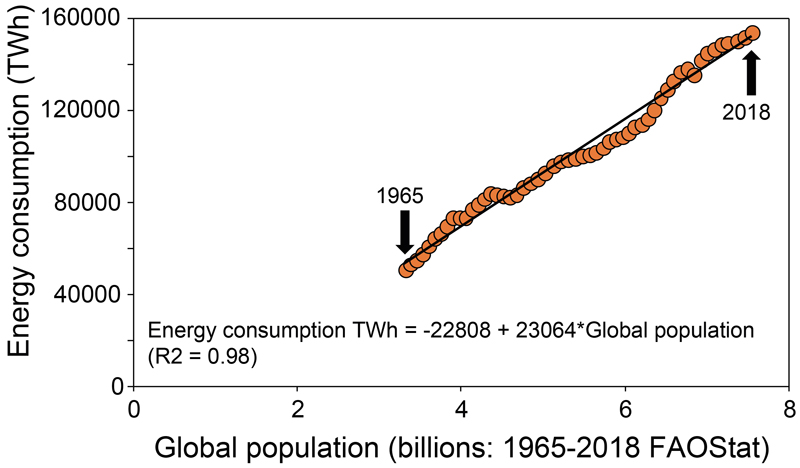 |
| Figure 4 Relationship between total global energy consumption (TWh; Smil 2017) and global population (billions; FAOStat 2019). Regression fitted by DPR Team, Lincoln University, New Zealand. |
After 1960 intensification through the “Green Revolution” was the main driver of food production. This human success story reduced global hunger and poverty and led to the most prosperous and peaceful period in human history. The advent of dwarf cereals, fertilised with newly minted nitrogen fertilisers, irrigation and agrichemicals for crop protection enabled higher yields and land sparing as production per hectare increased dramatically (Figure 5). Without intensification, the largely unchanged 0.5 BN hectares currently used for food production would have had to increase to 1.5BN more hectares of deforestation to feed the current population (Figure 6).
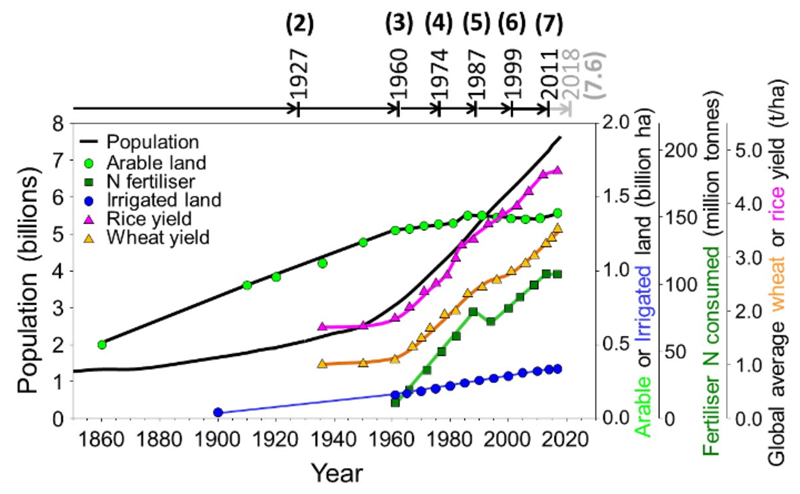 |
| Figure 5 Change in global population, area of arable land (billion ha), area of land equipped for irrigation (billon ha, quantity of N fertiliser consumed (million tonnes) and average wheat and rice yields (t/ha) over time. The acceleration of global population associated with different technologies is shown at the top of the figure with arrows. Modified and updated from an original figure from Evans 1998, subsequently updated by van Ittersum 2011. Additional data sourced from FAOSTAT (2019). |
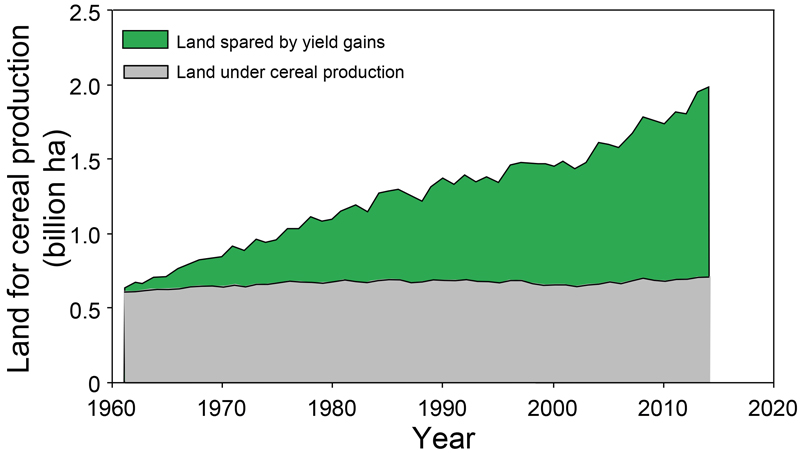 |
| Figure 6 Impart of the Genotype x Environment x Management (GxExM) interaction representing agricultural intensification on the amount of land spared from cereal production. Redrawn from: https://ourworldindata.org/grapher/global-land-spared-as-a-result-of-cereal-yield-improvements . Accessed: 4/10/2019. Based on data sourced from: http://data.worldbank.org/data-catalog/world-development-indicators. Accessed: 18/7/2017. |
This period of intensification met global food demand but has quite rightly been criticised for its environmental impacts, which are now in sharp focus. The overall impacts of fertiliser use and intensification are now being questioned at a local and global level.
In New Zealand our intensification was about 30 years later than the rest of the world and developed on the back of irrigation in Canterbury. Our increased use of N-based fertilisers increases nitrous oxide losses during application and CO2 losses in their production. However, the biological need of plants for nitrogen has not changed. All plants are nitrogen-deficient, which restricts leaf extension, and therefore light interception, as well as photosynthesis. Thus, current ryegrass-based pastures in New Zealand are frequently N deficient despite the greater inputs of inorganic fertilisers.
It was the quantification of our pastures’ N deficiency (Figure 7) that led our research to focus on legumes as the most sustainable way to provide N and overcome impacts of climate change for dryland east coast farmers. The success of this approach was documented by Doug Avery in his book “The Resilient Farmer”, in which he describes how his intensified grazing of lucerne has increased production and allowed him to spare other land areas for native forest regeneration.
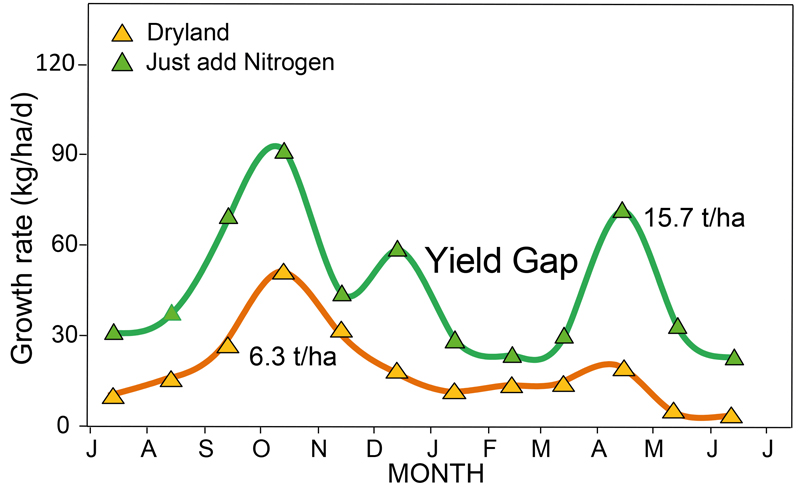 |
| Figure 7 Average mean daily growth rate (kg DM/ha/d) and annual production of a dryland 9-year-old cocksfoot monoculture at Lincoln University, New Zealand with or without non limiting N fertiliser (Mills et al. 2006; 2009). |
A feature of his story of change is that success was not straight-forward. He did not require any new species or fertiliser to improve production; he required only the management skills to implement new grazing rules for lucerne. His story highlights an important extension message, that “new management skills are not straight forward and negative results are to be expected.” Our role as researchers and the agribusiness community is to minimise this period of potentially negative output where there is a high risk of reversion to old methods.
The success at ‘Bonavaree’ gave us, as researchers, the confidence to continue to advocate for legume-based systems change on other farms. The 11-year journey of ‘Bog Roy Station’ at Otematata is now detailed in Moot et al. (2019) in the Journal of New Zealand Grasslands. Their weaned lamb production has increased by over 50% but importantly greater use of intensive grazing of lucerne has allowed regeneration of annual legumes to out-compete Hieracium pillosella on previously over-grazed high-country blocks.
This legume-based approach is now being promoted for other hill country farm systems. “Aerial no till” approaches, which have a low carbon footprint, can be used to develop hill country areas with lucerne, red clover or annual legumes, depending on the environment. The added nitrogen from the legumes in these carbon-dominant swards is producing increases of more than 75% in pasture production and providing high-quality feed that can grow animals quicker than the resident low-quality browntop and Danthonia species.
Other benefits accrue from increasing the use of legumes in hill country. It encourages farmers to refocus on the fertility requirements of the legume and encourages faster animal growth rates, contributing to measured reductions in methane-emission intensities. The threats looming to these systems may not be as environmentally, socially and financially sustainable for the communities of interest. The same hill country farms that could improve productivity from improved legume management are also being targeted for forestry development and penalised by inappropriate nutrient leaching modelling.
In both cases the Parliamentary Commissioner for the Environment has provided clear guidelines for a way forward that I support (see https://www.pce.parliament.nz/media/ 196493/overseer-and-regulatory-oversight-final-report-web.pdf). It remains to be seen whether a new generation of politicians are prepared to listen to scientific reality over political expediency as we look for management to lead the future of New Zealand Hill country.
References
Avery, D., Thomson, M. 2017. The Resilient Farmer. Auckland; Penguin Random House New Zealand. 283 p.
Evans, L.T. 1998. Feeding the Ten Billion: Plants and Population Growth. U.K.: Cambridge University Press. 264 p.
FAOSTAT. 2019. Global population, rice and wheat yields, N fertiliser consumption, Irrigated land area 1961-2018 sourced from: http://www.fao.org/faostat/en/#data/OA. Accessed 4/10/2019.
Mills, A., Moot, D.J., Jamieson, P.D. 2009. Quantifying the effect of nitrogen of productivity of cocksfoot (Dactylis glomerata L.) pastures. European Journal of Agronomy 30, 63-69.
Mills, A., Moot, D.J. and McKenzie, B.A. 2006. Cocksfoot pasture production in relation to environmental variables. Proceedings of the New Zealand Grassland Association 68, 89-94.
Moot, D.J., Anderson, P.V.A., Anderson, L.J., Anderson, D.K. 2019. Animal performance changes over 11 years after implementing a lucerne grazing system on Bog Roy Station. Journal of New Zealand Grasslands 81, 75-80.
NASA. 2019. Ice mass measurement by NASA’s GRACE satellites. https://climate.nasa.gov/ vital-signs/ice-sheets/. Date accessed: 30/9/2019.
Smil, V. (2017). Energy Transitions: Global and National Perspectives. & BP Statistical Review of World Energy. Online: http://vaclavsmil.com/2016/12/14/energy-transitions-global-and-national-perspectives-second-expanded-and-updated-edition/; https://www.bp.com/en/global/corporate/energy-economics/statistical-review-of-world-energy.html.
van Ittersum, M. K. 2011. Future Harvest: the fine line between myopia and utopia. In: Inaugural lecture upon taking up the post of Personal Professor of Plant Production Systems at Wageningen University on 12 May 2011. 34 p. Online: http://edepot.wur.nl/169680.
Wiese, D. N., Yuan, D. N., Boening, C., Landerer, F. W. and Watkins, M. M. 2016. JPL GRACE Mascon Ocean, Ice, and Hydrology Equivalent HDR Water Height RL05M.1 CRI Filtered Version 2. PO.DAAC, ed.). CA, USA. http://dx.doi.org/10.5067/TEMSC-2LCR5. Data accessed 1/10/2019. Website (https://climate.nasa.gov/vital-signs/ice-sheets/) last updated by the Earth Science Communications Team at NASA’s Jet Propulsion Laboratory | California Institute of Technology on 23/9/2019.